
Revista Andina de Educación 8(2) (2025)
Validation of the Chen and Starosta Intercultural Sensitivity Scale with Ecuadorian Secondary School Students
Validación de la escala de sensibilidad intercultural de Chen y Starosta con estudiantes ecuatorianos de secundaria
Felipe Quishpe-Guanoa 
 , Raúl Pérez-Fernándezb
a Ministerio de Educación. Dirección Nacional de Investigación Educativa. Av. Amazonas N34-451 y Av. Atahualpa, 170135, Quito, Ecuador.
b Universidad de Oviedo. Departamento de Estadística e Investigación Operativa y Didáctica de la Matemática. C/Federico García Lorca, 18, 33007, Oviedo, España.
Received on February 15, 2025. Accepted on June 23, 2025. Published on September 2, 2025
https://doi.org/10.32719/26312816.5565
© 2025 Quishpe & Pérez-Fernández. CC BY-NC 4.0
Abstract
Schools are spaces of social interaction where individuals from diverse backgrounds converge, making it essential to develop social competencies—among them, intercultural sensitivity—to foster respectful and peaceful coexistence. In this regard, it is necessary to have instruments that allow the measurement of students’ levels of intercultural sensitivity. This study aims to adapt the Intercultural Sensitivity Scale (ISS) developed by Chen and Starosta to the Ecuadorian context and to assess its validity and reliability among secondary school students through confirmatory factor analysis. For the validation process, the ISS—translated and culturally adapted—was administered to 5,497 students. Cronbach’s alpha indicated acceptable internal consistency (α = 0.856); however, the CFI and RMSEA indices suggested the need to adjust the model to better fit the national context. Several items exhibited low factor loadings (λ < 0.4), suggesting they should be reviewed or removed to enhance the representation of latent variables. Additionally, strong correlations were found between some factors, such as Respect and Engagement, while others, such as Attention and Enjoyment, showed weak correlations, indicating that they capture more specific aspects of the broader construct. After adjustments, the scale can be considered culturally adapted and validated for assessing intercultural sensitivity among Ecuadorian adolescents.
Keywords: intercultural sensitivity, psychometric assessment, instrument validation, confirmatory factor analysis, factor loading, secondary school students
Resumen
La escuela es un espacio de interacción social en el que confluyen personas de diferentes contextos, lo que hace necesario desarrollar competencias sociales, entre ellas la sensibilidad intercultural, para promover una convivencia respetuosa y pacífica. En este sentido, se requiere contar con instrumentos que permitan medir el nivel de sensibilidad intercultural de los estudiantes. El presente estudio tiene como objetivo adaptar la escala de sensibilidad intercultural (ISS) de Chen y Starosta al contexto ecuatoriano, y evaluar su validez y confiabilidad en estudiantes de secundaria mediante un análisis factorial confirmatorio. Para el proceso de validación se aplicó la ISS, traducida y adaptada al contexto ecuatoriano, a 5497 estudiantes. Los resultados del alfa de Cronbach mostraron una consistencia interna aceptable (a = 0,856); sin embargo, los índices CFI y RMSEA indicaron la necesidad de ajustar el modelo para el contexto nacional. Se identificaron ítems con cargas factoriales bajas (λ < 0,4), lo que sugiere que se revisen o eliminen dichos ítems para mejorar la representación de las variables latentes. Además, se encontraron correlaciones altas para algunos factores, como respeto y compromiso, mientras que, para otros factores, como atención y disfrute, se identificó una correlación baja, es decir que se captan aspectos más específicos del constructo general. Después de las modificaciones, la escala puede considerarse culturalmente adaptada y validada para evaluar la sensibilidad intercultural en adolescentes ecuatorianos.
Palabras clave: sensibilidad intercultural, evaluación psicométrica, validación de instrumentos, análisis factorial confirmatorio, carga factorial, estudiantes de secundaria
Introduction
Interaction between cultures is becoming increasingly frequent as globalization advances; therefore, there is a growing need to develop competencies that foster coexistence among people from different cultural backgrounds. In this context, intercultural sensitivity emerges as a key factor in promoting understanding between people from diverse origins, reducing prejudice, and strengthening social cohesion.
Intercultural sensitivity has been studied from various perspectives. To mention a few: individualism and collectivism (Bhawuk & Brislin, 1992), the theory of universal values (Schwartz & Bilsky, 1987; Blue et al., 1996), the constructivist and progressive development approach (Bennett, 2017), and intercultural competence (Chen, 1997). This research paper focuses on the approach proposed by Chen (1997, p. 5), who defines intercultural sensitivity as “an individual’s ability to develop a positive emotion towards understanding and appreciating cultural differences, which promotes appropriate and effective behavior in intercultural communication.” In other words, intercultural sensitivity refers to the ability of an individual to adapt to different cultural contexts, which is reflected in respectful interaction with others’ practices and worldviews.
In the educational field—particularly in countries like Ecuador, which have rich cultural diversity—it is crucial to have appropriate instruments for evaluating this competence in secondary school students. The measurement of intercultural sensitivity has been the subject of several studies, among which the most prominent are the Intercultural Sensitivity Scale (ISS) by Chen and Starosta (2000), the Developmental Model of Intercultural Sensitivity (Bennett, 2017), the Intercultural Development Inventory (Hammer et al., 2003), and the Cultural Intelligence Model (Ang et al., 2006). However, all these studies have focused on assessing intercultural sensitivity in university students, leaving a gap in the evaluation of adolescents in secondary education.
The ISS, developed by Chen and Starosta (2000), is a widely used instrument internationally to assess intercultural sensitivity across various contexts—for example, in the fields of health (Pineda et al., 2024; Dur et al., 2025; Dursun Ergezen & Aydın, 2025), education (Akcin, 2023; Beltrán et al., 2024; Jurković & Buterin Mičić, 2024), and business (Moradi & Ghabanchi, 2019). Furthermore, several studies support the theoretical validity of the construct measured by the ISS (Tamam, 2010; Wang & Zhou, 2016). Therefore, the objective of this research is to evaluate the validity and reliability of Chen and Starosta’s ISS when adapted for secondary school students in Ecuador, using a confirmatory factor analysis approach.
A search in the Scopus database using the keywords “intercultural AND sensitivity AND scale” revealed that, up to 2025, eleven studies on this topic had been published in South America. Of these, eight were conducted in Chile and were related to healthcare (Pineda et al., 2024), teacher training (Beltrán et al., 2024), public servants (Martínez et al., 2024), and education (Sanhueza et al., 2012 and 2021; Morales et al., 2017; Klenner et al., 2021; Cancino & Nuñez, 2023). Two studies were conducted in Argentina, both related to migration (Castro, 2012; Gómez et al., 2023). In the Ecuadorian context, only one study was found—that of González and Reyes (2019), who analyzed the psychometric characteristics of the ISS after applying the questionnaire to 706 university students. Given the scarcity of research in the region and the exclusive focus on university populations, it is necessary to extend these studies to earlier educational levels—such as students in upper basic education (EGB superior) and general unified high school (BGU)—taking into account the particularities of this formative stage and its relevance in developing intercultural competencies.
It is essential to have psychometric evidence specific to the Ecuadorian educational context, as knowing the level of intercultural sensitivity in a rigorous manner is crucial for building a pluralistic and inclusive citizenship. The absence of a scale for measuring intercultural sensitivity in specific contexts limits the ability to identify early on the strengths and weaknesses of this competence, thus hindering the design and evaluation of educational programs. In this regard, adapting and validating the ISS for Ecuadorian secondary school students helps to close the knowledge gap and provides the education system with a useful tool for future research.
The ISS comprises 24 items measured on a five-point Likert scale (“Strongly agree,” “Agree,” “Neither agree nor disagree,” “Disagree,” “Strongly disagree”). These items are organized into five factors: 1. Interaction engagement, which assesses enjoyment and positive disposition toward intercultural interactions; 2. Respect for cultural differences, which measures the ability to accept different behaviors and cultural values; 3. Interaction confidence, which evaluates confidence and security when interacting with individuals from other cultures; 4. Interaction enjoyment, which analyzes positive emotions associated with intercultural interaction; and 5. Interaction attentiveness, which examines awareness and sensitivity to subtle elements present in cross-cultural exchanges.
These five factors were identified in the initial phase of the study by Chen and Starosta (2000), in which a 44-item version of the scale was administered to 152 male and 262 female university students. Through exploratory factor analysis, a final version of 24 items was obtained. In the second phase of their study, the authors assessed the concurrent validity of the instrument using a sample of 162 university students (66 male and 96 female), and reported a Cronbach’s alpha of 0.86 for the overall instrument, thus confirming its internal consistency.
Methodology and Materials
This study followed a quantitative research design based on confirmatory factor analysis (CFA)—a technique within the framework of structural equation modeling—to establish relationships between observed indicators (Brown, 2006). CFA is a method used to determine whether a theoretical measurement model fits the observed data (Hair et al., 2019). In this context, observed variables were used to measure or represent latent variables, with the aim of estimating both the relationships between observed and latent variables and the interactions among the latent variables themselves (Kaplan, 2000). Specifically, five latent variables (dimensions) were considered in this study: 1. Interaction engagement, 2. Respect for cultural differences, 3. Interaction confidence, 4. Interaction enjoyment, 5. Interaction attentiveness. All these dimensions align with the model originally proposed by Chen and Starosta (2000).
Participant selection was carried out through non-probabilistic sampling (Hernández Sampieri & Mendoza, 2018), targeting a total of 6,714 students in the final years of each educational level or sublevel, from schools affiliated with the Fundación Fe y Alegría Ecuador. Ultimately, 5,497 students participated in the study (see Table 1), comprising 2,497 females and 3,000 males, with ages ranging from 12 to 18 years. It is important to note that the selected schools are located in both urban and rural areas, allowing the data to reflect a wide range of cultural, ethnic, and socioeconomic diversity.
Table 1. Distribution of participating students
|
Educational Level1 |
Female |
Male |
|
10th grade (EGB) |
562 |
521 |
|
7th grade (EGB) |
1051 |
1672 |
|
3rd year (BGU) |
884 |
807 |
|
Total |
2,497 |
3,000 |
|
|
|
|
Source: Authors (2025).
To ensure that the ISS was appropriate for the students, a translation and adaptation process was carried out (Table 2), maintaining the original intent of the authors while adjusting the wording to the language of the participating students. A pilot study was then conducted with 30 students, in which an overall Cronbach’s alpha of 0.83 was obtained—surpassing the accepted threshold of 0.7 (Oviedo & Campo, 2005). This indicates a very good overall internal consistency. Based on these preliminary results, the questionnaire was administered to the students selected for this study.
The final questionnaire consisted of 7 items in the Interaction Engagement dimension, 6 items in Respect for Cultural Differences, 5 items in Interaction Confidence, 3 items in Interaction Enjoyment and 3 items in Interaction Attentiveness.
It is important to note that, to ensure compliance with ethical principles, informed consent was obtained from the students’ legal guardians before administering the questionnaire. In addition, at the beginning of the form (hosted on Google Forms), students were informed about the confidentiality of the data and the voluntary nature of their participation in the study. The data collected was used exclusively for research purposes and was not disseminated through any medium.
Table 2. ISS adapted for secondary school students
|
Intercultural Sensitivity Factors |
Item Number |
Ítem |
|
Interaction Engagement |
1 |
I enjoy the differences between a person from another culture and myself. |
|
2 |
I enjoy interacting with people from different cultures. |
|
|
3 |
I avoid situations where I have to deal with people from different cultures. |
|
|
4 |
I prefer to wait before forming opinions about people from other cultures. |
|
|
5 |
I regularly respond positively when interacting with people from different cultures. |
|
|
6 |
I have an open mind toward people from different cultures. |
|
|
7 |
I often show people from other cultures that I understand them, either through words or gestures. |
|
|
Respect for Cultural Differences |
8 |
I respect the way people from different cultures behave. |
|
9 |
I respect the values of people from different cultures. |
|
|
10 |
I would not accept the opinions of people from different cultures. |
|
|
11 |
I believe people from other cultures are not open-minded. |
|
|
12 |
I do not like being with people from different cultures. |
|
|
13 |
I believe my culture is better than other cultures. |
|
|
Interaction Confidence |
14 |
I feel very confident when interacting with people from different cultures. |
|
15 |
I feel confident when interacting with people from different cultures. |
|
|
16 |
I always know what to say when interacting with people from different cultures. |
|
|
17 |
It is very difficult for me to speak in front of people from different cultures. |
|
|
18 |
I can be as friendly as I want when interacting with people from different cultures. |
|
|
Interaction Enjoyment |
19 |
I often feel discouraged when I am with people from different cultures. |
|
20 |
I get angry easily when interacting with people from different cultures. |
|
|
21 |
I often feel useless when interacting with people from other cultures. |
|
|
Interaction Attentiveness |
22 |
I am very observant when interacting with people from different cultures. |
|
23 |
I try to gather as much information as possible when interacting with people from different cultures. |
|
|
24 |
I can perceive hidden or subtle messages from people of other cultures when we interact. |
|
|
|
|
Note: Items 1, 3, 4, 5, 6, 7, 11, 14, 16, 18, 19, 21, and 24 were translated and linguistically adapted to the level of students in upper basic education and unified general baccalaureate, while the remaining items were directly translated from the original English version. For data analysis, negatively worded items (3, 10, 11, 12, 13, 17, 19, 20, and 21) were reverse-coded so that higher scores consistently reflected greater intercultural sensitivity.
Source: Chen and Starosta (2000).
Data analysis included descriptive statistics to characterize the sample, as well as inferential and multivariate statistics (Canavos, 1988). CFA was conducted using the Lavaan package in RStudio, version R 4.4.1.
Results
Based on the students’ responses, a descriptive analysis was conducted to characterize the sample, followed by reliability and validity assessments using Cronbach’s alpha and confirmatory factor analysis (CFA), respectively.
First, Table 3 shows the participation of 5,497 students. The highest proportion corresponded to 7th grade students in upper basic education (49%), followed by 10th grade students (30.8%). The lowest participation was from 3rd-year students of the Unified General Baccalaureate (19.7%).
Table 3. Students surveyed by educational level
|
Educational Level |
Students |
Percentage of Students |
|
10th grade (EGB) |
2,723 |
49.5 % |
|
7th grade (EGB) |
1,691 |
30.8 % |
|
3rd year (BGU) |
1,083 |
19.7 % |
|
Total |
5,497 |
100 % |
|
|
|
|
Source: Authors (2025).
In terms of ethnic self-identification (Table 4), most students identified as mestizo (78.94%), followed by Indigenous (7.95%), Afro-Ecuadorian (6.31%), and Montubio (5.41%). White students accounted for 1.31%, while the categories “Foreigner” and “Other” had the lowest representation at just 0.05% each. These percentages closely align with data reported in the 2022 national census (National Institute of Statistics and Census [INEC], 2025).
Table 4. Ethnic self-identification of surveyed students
|
Ethnic Self- Identification |
No. of Students |
Percentage |
National Percentage |
|
Afro-Ecuadorian |
347 |
6.31 % |
4.8 % |
|
White |
72 |
1.31 % |
2.2 % |
|
Foreigner |
3 |
0.05 % |
- |
|
Indigenous |
437 |
7.95 % |
7.7 % |
|
Mestizo |
4,338 |
78.92 % |
77.5 % |
|
Montubio |
297 |
5.40 % |
7.7 % |
|
Other |
3 |
0.05 % |
0.1 % |
|
Total |
5,497 |
100 % |
100 % |
|
|
|
|
|
Note: National percentages based on the 2022 census (INEC, 2025).
Source: Authors (2025).
Regarding area of residence (Table 5), 83.37% of students lived in urban areas, while 16.63% came from rural settings. This suggests a strong concentration of the student population in urban contexts, likely due to greater access to educational institutions in these areas.
Table 5. Students by area of residence
|
Area |
No. of students |
Percentage |
|
Rural |
914 |
16.63 % |
|
Urban |
4,583 |
83.37 % |
|
Total |
5,497 |
100 % |
|
|
|
|
Source: Authors (2025).
It is important to note that, prior to data analysis, responses to negatively worded items (3, 10, 11, 12, 13, 17, 19, 20, and 21) were reverse-coded to ensure that higher scores consistently indicated greater intercultural sensitivity. Under these conditions, the reliability analysis (Table 6) showed a Cronbach’s alpha of 0.856, indicating high internal consistency. The standardized alpha was similarly high (0.862), and Guttman’s lambda-6 reached 0.904, further confirming item homogeneity. The mean score was 4.01 with a standard deviation of 0.43, suggesting that most responses fell around the “Agree” level on the Likert scale, with relatively low dispersion.
Table 6. Reliability analysis of the ISS
|
Measure |
Obtained Value |
|
Raw Cronbach’s alpha (raw_alpha) |
0.856 |
|
Standardized alpha (std.alpha) |
0.862 |
|
Guttman’s lambda-6 (G6) |
0.904 |
|
Average inter-item correlation |
0.207 |
|
Signal-to-noise ratio (S/N) |
6.25 |
|
Standard error of alpha (ase) |
0.0028 |
|
Mean score |
4.01 |
|
Standard deviation (sd) |
0.43 |
|
Median inter-item correlation |
0.192 |
|
|
|
Source: Authors (2025).
Table 7 presents the results of the confirmatory factor analysis (CFA) conducted to assess the validity of the five-factor structure proposed by Chen and Starosta (2000), using the 24 items translated and culturally adapted to the Ecuadorian context. The model’s chi-square statistic was significant: χ² = 24,454.728 (df = 242, p < 0.001), suggesting that the theoretical model did not adequately fit the data. However, in large samples, even minor discrepancies may yield significant results (Kline, 2023), so additional fit indices were considered.
In this case, moderate model fit was found, with a Comparative Fit Index (CFI) of 0.880 and a Tucker-Lewis Index (TLI) of 0.863, both close to the commonly accepted threshold of 0.90. The Root Mean Square Error of Approximation (RMSEA) was 0.152, with a 90% confidence interval of [0.150–0.153], exceeding the recommended cutoff of 0.08, indicating a substantial mismatch between the observed structure and the theoretical model. Similarly, the Standardized Root Mean Square Residual (SRMR) was 0.124, above the acceptable limit of 0.08, reinforcing the need to revise the model to better reflect how intercultural sensitivity is manifested in the Ecuadorian educational context.
|
Index |
Obtained Value |
|
Chi-square (χ²) |
24,454.728 |
|
Degrees of freedom (df) |
242 |
|
p-value (Chi-square) |
< 0.001 |
|
CFI |
0.880 |
|
TLI |
0.863 |
|
RMSEA |
0.135 |
|
RMSEA Confidence Interval |
0.133-0.136 |
|
SRMR |
0.124 |
|
|
|
Source: Authors (2025).
Figure 1 illustrates the CFA model with estimated relationships between items and the five latent factors proposed by Chen and Starosta (2000), along with the inter-factor correlations and measurement errors. The covariance results showed positive and significant relationships between latent factors, with standardized correlations ranging from 0.48 to 0.85. In particular, high correlations were found between Respect and Engagement (0.854), and between Respect and Enjoyment (0.823), indicating strong interconnections among these dimensions of intercultural sensitivity. In contrast, weaker correlations were found between Attentiveness and Enjoyment (0.497), and between Attentiveness and Respect (0.481), suggesting that these factors capture more distinct aspects of the general construct.
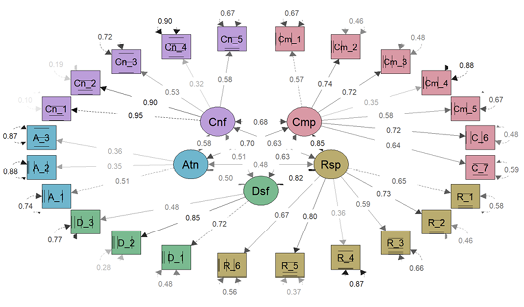
Figure 1. Representation of the intercultural sensitivity model with five factors
Source: Authors (2025).
Upon reviewing the standardized factor loadings for each item to evaluate the strength of their relationship with the intended latent factor (Table 8), several items showed low factor loadings (λ < 0.4), Comp_4 (“I prefer to wait before forming opinions about people from other cultures”), Resp_4 (“I believe people from other cultures are not open-minded”), Aten_2 (“I try to gather as much information as possible when interacting with people from different cultures”), Aten_3 (“I can perceive hidden or subtle messages when interacting with people from other cultures”), Conf_4 (“It is very difficult for me to speak in front of people from different cultures”). According to the literature, these items demonstrate weak relationships with their respective latent factors (Hair et al., 2019).
Table 8. Standardized factor loadings
|
Item |
Engagement |
Respect |
Enjoyment |
Attentiveness |
Confidence |
|
Comp_1 |
0.571 |
0.000 |
0.000 |
0.000 |
0.000 |
|
Comp_2 |
0.737 |
0.000 |
0.000 |
0.000 |
0.000 |
|
Comp_3 |
0.723 |
0.000 |
0.000 |
0.000 |
0.000 |
|
Comp_4 |
0.352 |
0.000 |
0.000 |
0.000 |
0.000 |
|
Comp_5 |
0.578 |
0.000 |
0.000 |
0.000 |
0.000 |
|
Comp_6 |
0.725 |
0.000 |
0.000 |
0.000 |
0.000 |
|
Comp_7 |
0.643 |
0.000 |
0.000 |
0.000 |
0.000 |
|
Resp_1 |
0.000 |
0.647 |
0.000 |
0.000 |
0.000 |
|
Resp_2 |
0.000 |
0.733 |
0.000 |
0.000 |
0.000 |
|
Resp_3 |
0.000 |
0.586 |
0.000 |
0.000 |
0.000 |
|
Resp_4 |
0.000 |
0.355 |
0.000 |
0.000 |
0.000 |
|
Resp_5 |
0.000 |
0.795 |
0.000 |
0.000 |
0.000 |
|
Resp_6 |
0.000 |
0.666 |
0.000 |
0.000 |
0.000 |
|
Disf_1 |
0.000 |
0.000 |
0.721 |
0.000 |
0.000 |
|
Disf_2 |
0.000 |
0.000 |
0.849 |
0.000 |
0.000 |
|
Disf_3 |
0.000 |
0.000 |
0.479 |
0.000 |
0.000 |
|
Aten_1 |
0.000 |
0.000 |
0.000 |
0.514 |
0.000 |
|
Aten_2 |
0.000 |
0.000 |
0.000 |
0.346 |
0.000 |
|
Aten_3 |
0.000 |
0.000 |
0.000 |
0.364 |
0.000 |
|
Conf_1 |
0.000 |
0.000 |
0.000 |
0.000 |
0.949 |
|
Conf_2 |
0.000 |
0.000 |
0.000 |
0.000 |
0.902 |
|
Conf_3 |
0.000 |
0.000 |
0.000 |
0.000 |
0.531 |
|
Conf_4 |
0.000 |
0.000 |
0.000 |
0.000 |
0.319 |
|
Conf_5 |
0.000 |
0.000 |
0.000 |
0.000 |
0.576 |
|
|
|
|
|
|
|
Source: Authors (2025).
Based on this analysis, a model adjustment process was initiated. First, the items with standardized loadings below 0.4 (Comp_4, Resp_4, Aten_2, Aten_3, and Conf_4) were removed. The CFA of the new model with 19 items revealed that the Attentiveness factor consisted of only one item, which yielded a very low factor loading (Aten_1, λ = 0.22). Additionally, a low communality was found for item Disf_3 (h² = 0.21). Despite this, the analysis confirmed that a five-factor model best captured the latent structure of intercultural sensitivity (Figure 2). It also revealed that items Comp_3, Resp_3, Resp_5, and Resp_6 coherently clustered into a new factor defined as Ethnocentrism in Interaction (ethnocentrism). As a result, these items were subsequently excluded.
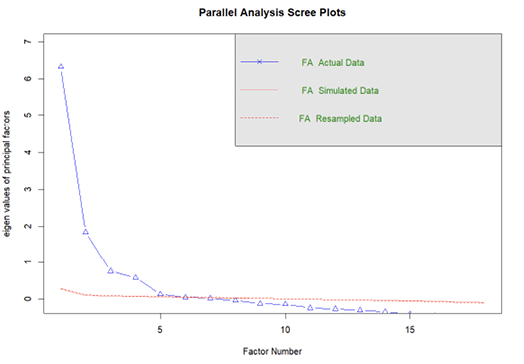
Figure 2. Parallel analysis: comparison of real and simulated eigenvalues
Source: Authors (2025).
Following the adjustment process of the original 24-item model (Chen & Starosta, 2000), a revised model with 16 items was developed, as shown in Table 9.
|
Intercultural Sensitivity Factors |
Item No. |
Items |
|
Interaction Engagement |
1 |
I enjoy the differences between a person from another culture and myself. |
|
2 |
I enjoy interacting with people from different cultures. |
|
|
3 |
I regularly respond positively when interacting with people from different cultures. |
|
|
4 |
I have an open mind toward people from different cultures. |
|
|
5 |
I often show people from other cultures that I understand them, either through words or gestures. |
|
|
Respect for Cultural Differences |
6 |
I respect the way people from different cultures behave. |
|
7 |
I respect the values of people from different cultures. |
|
|
Interaction Confidence |
8 |
I feel very confident when interacting with people from different cultures. |
|
9 |
I feel confident when interacting with people from different cultures. |
|
|
10 |
I can be as friendly as I want when interacting with people from different cultures. |
|
|
Interaction Enjoyment |
11 |
I often feel discouraged when I am with people from different cultures. |
|
12 |
I get angry easily when interacting with people from different cultures. |
|
|
Ethnocentrism in Interaction |
13 |
I avoid situations where I have to deal with people from different cultures. |
|
14 |
I would not accept the opinions of people from different cultures. |
|
|
15 |
I do not like being with people from different cultures. |
|
|
16 |
I believe my culture is better than other cultures. |
|
|
|
|
Source: Authors (2025).
The overall fit of the revised model outperformed that of the original. Specifically, the chi-square statistic was χ² = 4,233.49 (df = 93, p < 0.001). Additionally, the model met all recommended fit indices: CFI = 0.979, TLI = 0.973 (≥ 0.95), RMSEA = 0.090 with a 90% CI of [0.088–0.092], and SRMR = 0.073 (≤ 0.08). The standardized factor loadings ranged from 0.54 to 0.96 (Table 10), indicating good convergent validity.
Table 10. Factor loadings of the adjusted model
|
Factor |
Item |
Loading |
|
Engagement |
Comp_1 |
0.545 |
|
Engagement |
Comp_5 |
0.640 |
|
Engagement |
Comp_7 |
0.664 |
|
Engagement |
Comp_2 |
0.736 |
|
Engagement |
Comp_6 |
0.754 |
|
Confidence |
Conf_5 |
0.572 |
|
Confidence |
Conf_2 |
0.905 |
|
Confidence |
Conf_1 |
0.963 |
|
Enjoyment |
Disf_1 |
0.663 |
|
Enjoyment |
Disf_2 |
0.742 |
|
Ethnocentrism |
Resp_3 |
0.668 |
|
Ethnocentrism |
Resp_6 |
0.727 |
|
Ethnocentrism |
Comp_3 |
0.787 |
|
Ethnocentrism |
Resp_5 |
0.884 |
|
Respect |
Resp_1 |
0.749 |
|
Respect |
Resp_2 |
0.818 |
|
|
|
|
Source: Authors (2025).
The internal consistency of the revised 16-item instrument (Table 11) was also evaluated. The composite reliability (ω) ranged from 0.59 to 0.82, and the average variance extracted (AVE) exceeded 0.49 in four of the five factors. Although the AVE for the Engagement factor was slightly below the recommended threshold (0.45), its composite reliability was above 0.70, which is considered acceptable. In summary, the adjustment process produced a five-factor instrument that is both psychometrically sound and conceptually consistent with the original ISS framework, making it suitable for use with Ecuadorian secondary school students.
Table 11. Composite reliability and convergent validity of the adjusted model
|
Ethnocentrism |
Engagement |
Confidence |
Enjoyment |
Respect |
|
|
alpha |
0.8018352 |
0.7267703 |
0.7071120 |
0.6492918 |
0,6709954 |
|
alpha.ord |
0.8510184 |
0.8158072 |
0.7444497 |
0.6594303 |
0,7598386 |
|
omega |
0.8111682 |
0.7175511 |
0.8204424 |
0.5947938 |
0,6629858 |
|
omega2 |
0.8111682 |
0.7175511 |
0.8204424 |
0,5947938 |
0.6629858 |
|
omega3 |
0.8076261 |
0.7109551 |
0.9303245 |
0,5947935 |
0.6629859 |
|
avevar |
0.5942590 |
0.4518491 |
0.6912452 |
0,4950226 |
0.6151287 |
|
|
|
|
|
|
|
Note: For constructs with categorical indicators, both standard alpha and “ordinal alpha” were calculated, as proposed by Zumbo et al. (2007), given that traditional alpha treats ordinal variables as numeric. See Chalmers (2018) for a critique of alpha.ord and the reply by Zumbo & Kroc (2019). Similarly, AVE was estimated using polychoric (or polyserial) correlations, rather than Pearson correlations.
Source: Authors (2025).
Discussion
The findings of this study provide relevant insights into the intercultural sensitivity of high school students in Ecuador. The distribution of self-identified ethnic background shows that the majority of participants were mestizo students (78.94%), and that most of the student population lived in urban areas (83.37%). Therefore, the results on intercultural sensitivity in the educational setting may be conditioned by the sociodemographic characteristics of the participants.
The results show that the original ISS model (Chen & Starosta, 2000) presents a low goodness-of-fit index, confirming the need to assess intercultural sensitivity through an instrument adapted to the Ecuadorian context, considering the cultural particularities of the student environment. This aligns with the findings of González and Reyes (2019, p. 7), who, after applying the ISS to 706 university students, regrouped the items into two “communalities” via EFA: one containing the negatively worded questions and the other the positively worded ones.
In addition, this study found acceptable internal consistency, with a Cronbach’s alpha of 0.856—higher than that found in other studies, where reported values ranged from 0.722 to 0.815 (Gómez et al., 2023). However, this result is lower than that reported by González and Reyes (2019), which was 0.921. Furthermore, the global fit indices obtained in this study did not meet standard recommended thresholds (χ² [242] = 24,454.78, p < .001; CFI = 0.880; RMSEA = 0.152; TLI = 0.863; and SRMR = 0.124). These findings suggest the need to adjust the model to the Ecuadorian context, in line with previous studies that identified items with low factor loadings (González & Reyes, 2019). Overall, the results highlight the importance of adapting the ISS questionnaire to better capture students’ perceptions of intercultural sensitivity within Ecuadorian education.
The CFA results showed that the strongest correlations were between Respect and Commitment, and between Respect and Enjoyment—unlike the findings of González and Reyes (2019), who reported stronger correlations between Attention and Confidence, Confidence and Commitment, and Attention and Respect. Moreover, low correlations were found between Attention and Enjoyment and between Attention and Respect, suggesting that the Attention factor captures more specific aspects of the broader construct (intercultural sensitivity).
Several items were found to have low factor loadings (below 0.4): Comp_4, Resp_4, Aten_2, Aten_3, and Conf_4. These items had low ability to adequately represent the proposed latent factors and may be measuring aspects inconsistent with the theoretical structure of the model. These results also align with previous research, such as Wang and Zhou (2016), who identified similar limitations in applying the Chen and Starosta model to cultural contexts different from the original. They proposed a shortened 15-item version while retaining the original dimensions. It is worth noting that the items they eliminated correspond to Comp_4, Aten_3, and Conf_4—also identified in this study as having low factor loadings. This reinforces the need to revise the model by eliminating or merging items to create a shorter version better suited for high school students.
Accordingly, the original structure of the Chen and Starosta (2000) model was adjusted in response to the results obtained in the Ecuadorian context. First, items with weak factor loadings (λ < 0.4) were eliminated as irrelevant (Hair et al., 2019). Although the five-factor structure remained, the Attention construct was removed because it only contained one item, which compromised its convergent validity. Subsequently, the negatively worded items (González & Reyes, 2019) were grouped into a new factor called Ethnocentrism, which reflects attitudes of overvaluing and attachment to one’s own culture (Alaminos et al., 2010; Cruz et al., 2018). This process resulted in a revised 16-item instrument tailored to Ecuadorian high school students, intended to better reflect the construct of intercultural sensitivity.
Ultimately, the results of this study confirm the relevance of adapting intercultural sensitivity measurement models to diverse educational contexts. However, certain limitations should be acknowledged, such as the predominance of participants from urban areas and mestizo backgrounds, which limits the generalizability of the findings. Future research should explore how contextual factors (socioeconomic status, cultural diversity, age, gender, etc.) influence student responses. Likewise, it would be beneficial to apply this revised version to new samples to verify and confirm its validity as an instrument for identifying intercultural sensitivity.
Conclusions
The five-factor structure proposed by Chen and Starosta (2000) demonstrated acceptable psychometric performance in terms of internal consistency, based on Cronbach’s alpha results. However, global fit indices such as CFI and RMSEA indicated the need to adjust the model. This was supported by the identification of five items with low factor loadings (λ < 0.4), suggesting they may not accurately reflect students’ perceptions of intercultural sensitivity in the Ecuadorian educational context. These findings support the need to adapt and validate intercultural sensitivity measurement instruments for specific populations.
The ISS adjustment, through item elimination and regrouping, resulted in an adapted instrument for the Ecuadorian context, consisting of 16 items organized into five factors, as in the original model. However, the Attention factor was removed, and four items were regrouped into a new factor called Ethnocentrism. Thus, intercultural sensitivity in this revised version is measured through the factors of Interaction Commitment, Respect for Different Cultures, Interaction Confidence, Interaction Enjoyment, and Ethnocentrism in Interaction.
The adapted ISS can serve as a useful tool to assess the effects of educational policies aimed at strengthening intercultural sensitivity within the education system. Future research should explore how this revised model performs when considering cultural, demographic, and socioeconomic factors to assess the validity of the instrument.
Referencias
Akcin, H. (2023). Turkish Language Teachers’ Intercultural Sensitivity. International Journal of Education and Literacy Studies, 11(3), 145-156. http://dx.doi.org/10.7575/aiac.ijels.v.11n.3p.145
Alaminos, A., López, C., & Santacreu, O. (2010). Etnocentrismo, xenofobia y migraciones internacionales en una perspectiva comparada. Convergencia. Revista de Ciencias Sociales, 53, 91-124. https://tinyurl.com/4bfw5n2e
Ang, S., Van Dyne, L., & Koh, C. (2006). Personality Correlates of the Four-Factor Model of Cultural Intelligence. Group & Organization Management, 31(1), 100-123. https://doi.org/10.1177/1059601105275267
Beltrán, J., Gálvez, J., Klenner, M., & Vera, N. (2024). Adaptation and Validation of the Intercultural Effectiveness Scale in a Sample of Initial Teacher Training Students in Chile. Behavioral Sciences, 14(10). https://doi.org/10.3390/bs14100864
Bennett, M. (2017). Developmental Model of Intercultural Sensitivity. En Y. Kim (ed.), The International Encyclopedia of Intercultural Communication. John Wiley & Sons. https://doi.org/10.1002/9781118783665.ieicc0182
Bhawuk, D., & Brislin, R. (1992). The Measurement of Intercultural Sensitivity Using the Concepts of Individualism and Collectivism. International Journal of Intercultural Relations, 16(4), 413-436. https://doi.org/10.1016/0147-1767(92)90031-O
Blue, J., Kapoor, S., & Comadena, M. (1996). Using Values as a Measure of Intercultural Sensitivity. Intercultural Communication Studies, 6(2), 77-94. https://tinyurl.com/mrxpyzwt
Brown, T. (2006). Confirmatory Factor Analysis for Applied Research. Guilford Press. https://tinyurl.com/5n8zd7v4
Canavos, G. (1988). Probabilidad y estadística: Aplicaciones y métodos. McGraw-Hill. https://tinyurl.com/3jbvekrk
Cancino, M., & Nuñez, I. (2023). EFL Teachers’ Perceptions towards Multicultural Classrooms: The Role of Intercultural Sensitivity in Developing Intercultural Communicative Competence. rEFLections, 30(3). https://doi.org/10.61508/refl.v30i3.267833
Castro, A. (2012). La evaluación de las competencias culturales: Validación del inventario ICC. Interdisciplinaria, 29(1), 109-132. https://tinyurl.com/3dxy88nt
Chalmers, R. P. (2018). On Misconceptions and the Limited Usefulness of Ordinal Alpha. Educational and Psychological Measurement, 78(6), 1056–1071. https://doi.org/10.1177/0013164417727036
Chen, G. (1997). A Review of the Concept of Intercultural Sensitivity. Ponencia presentada en la Biennial Convention of the Pacific and Asian Communication Association, Honolulu, Estados Unidos, enero. https://tinyurl.com/m9j4rrhc
Chen, G., & Starosta, W. (2000). The Development and Validation of the Intercultural Sensitivity Scale. Ponencia presentada en la 86th Annual Meeting of the National Communication Association, Seattle, Estados Unidos, 8-12 de noviembre. https://tinyurl.com/ybzjuvp4
Cruz, M., Ortiz, M., Yantalema, F., & Orozco, P. (2018). Relativismo cultural, etnocentrismo e interculturalidad en la educación y la sociedad en general. Academo. Revista de Investigación en Ciencias Sociales y Humanidades, 5(2). http://dx.doi.org/10.30545/academo.2018.jul-dic.10
Dur, Ş., Gol, I., Erkin, Ö., & Coşğun, M. (2025). The Relationship between Moral Distress and Cultural Sensitivity Levels in Pediatric Nurses: A Cross-Sectional Study. Journal of Pediatric Nursing, 80, 49-55. https://doi.org/10.1016/j.pedn.2024.11.008
Dursun Ergezen, F., & Aydın, R. (2025). The Relationship between Intercultural Sensitivity, Ethnocentrism, Socio-Demographic Characteristics and Xenophobia in Nursing Students: A Descriptive and Multi-Centric Study. Nurse Education Today, 144. https://doi.org/10.1016/j.nedt.2024.106443
Gómez, T., Etchezahar, E., Albalá, M., & Maldonado, A. (2023). Validation of the Intercultural Sensitivity Scale in the Spanish Context. Frontiers in Education, 8. https://doi.org/10.3389/feduc.2023.1208081
González, E., & Reyes, C. (2019). Validación de la escala de sensibilidad intercultural en estudiantes universitarios ecuatorianos. Ponencia presentada en la 17th LACCEI International Multi-Conference for Engineering, Education, and Technology: “Industry, Innovation, and Infrastructure for Sustainable Cities and Communities”, Jamaica, 24-26 de julio. https://doi.org/10.18687/LACCEI2019.1.1.162
Hair, J., Black, W., Babin, B., & Anderson, R. (2019). Multivariate Data Analysis. Cengage. https://tinyurl.com/5667dr2p
Hammer, M., Bennett, M., & Wiseman, R. (2003). Measuring Intercultural Sensitivity: The Intercultural Development Inventory. International Journal of Intercultural Relations, 27(4), 421-443. https://doi.org/10.1016/S0147-1767(03)00032-4
Hernández Sampieri, R., & Mendoza, C. (2018). Metodología de la investigación: Las rutas cuantitativa, cualitativa y mixta. McGraw-Hill. https://tinyurl.com/52vjbr6c
INEC (2025). Resultados principales nacionales. INEC. https://tinyurl.com/3wk424pb
Jurković, D., & Buterin Mičić, M. (2024). Determinants of Intercultural Sensitivity of Teacher Education Students: Contribution of Multicultural Experience and Socio-Demographic Characteristics. Metodicki Ogledi, 31(1), 93-120. https://doi.org/10.21464/mo.31.1.9
Kaplan, D. (2000). Structural Equation Modeling: Foundations and Extensions Advanced Quantitative Techniques in the Social Sciences. Sage. https://tinyurl.com/45ce7u76
Klenner, M., Gálvez, J., & Beltrán, J. (2021). Factor Structure of the Intercultural Sensitivity Scale (ISS) in a Sample of University Students from Chile. International Journal of Intercultural Relations, 82, 168-174. https://doi.org/10.1016/j.ijintrel.2021.03.015
Kline, R. (2023). Principles and Practice of Structural Equation Modeling. Guilford Press. https://tinyurl.com/dxxv9kvn
Martínez, G., Chávez, D., & Guglielmetti, F. (2024). Spanish Translation, Adaptation and Psychometric Analysis of a Short Version of the Intercultural Sensitivity Scale in Chilean Public Workers. Psychological Reports. https://doi.org/10.1177/00332941241301360
Moradi, E., & Ghabanchi, Z. (2019). Intercultural Sensitivity: A Comparative Study among Business English Undergraduate Learners in Two Countries of Iran and China. Journal of Ethnic and Cultural Studies, 6(3), 134-146. https://doi.org/10.29333/ejecs/278
Morales, K., Sanhueza, S., Friz, M., & Riquelme, P. (2017). The Intercultural Sensitivity of Chilean Teachers Serving an Immigrant Population in Schools. Journal of New Approaches in Educational Research, 6, 71-77. https://doi.org/10.7821/naer.2016.8.173
Oviedo, H., & Campo, A. (2005). Aproximación al uso del coeficiente alfa de Cronbach. Revista Colombiana de Psiquiatría, 34(4), 572-580. https://tinyurl.com/ywtafbdt
Pineda, P., Klenner, M., Espinoza, G., Mariño, R., & Zaror, C. (2024). Intercultural Sensitivity in Chilean Healthcare Profession Students. BMC Medical Education, 24. https://doi.org/10.1186/s12909-024-05443-w
Sanhueza, S., Cardona, C., & Friz, M. (2012). La sensibilidad intercultural en el alumnado de educación primaria y secundaria de la provincia de Alicante. Perfiles Educativos, 34(136). https://tinyurl.com/4rcf4bh4
Sanhueza, S., Cardona, M., Herrera, V., Berlanga, M., & Friz, M. (2021). Sensibilidad intercultural en el alumnado y su relación con la actitud y estilo docente del profesorado ante la diversidad cultural. Interciencia, 46(6), 256-264. https://tinyurl.com/yyj9humd
Schwartz, S., & Bilsky, W. (1987). Toward a Universal Psychological Structure of Human Values. Journal of Personality and Social Psychology, 53(3), 550-562. https://doi.org/10.1037/0022-3514.53.3.550
Tamam, E. (2010). Examining Chen and Starosta’s Model of Intercultural Sensitivity in a Multiracial Collectivistic Country. Journal of Intercultural Communication Research, 39(3), 173-183. https://doi.org/10.1080/17475759.2010.534860
Wang, W., & Zhou, M. (2016). Validation of the Short Form of the Intercultural Sensitivity Scale (ISS-15). International Journal of Intercultural Relations, 55, 1-7. https://doi.org/10.1016/j.ijintrel.2016.08.002
Zumbo, B. D., Gadermann, A. M., & Zeisser, C. (2007). Ordinal Versions of Coefficients Alpha and Theta for Likert Rating Scales. Journal of Modern Applied Statistical Methods, 6(1), 21–29. https://doi.org/10.22237/jmasm/1177992180
Zumbo, B. D., & Kroc, E. (2019). A Measurement Is a Choice and Stevens’ Scales of Measurement Do Not Help Make It: A Response to Chalmers. Educational and Psychological Measurement, 79(6), 1184–1197. https://doi.org/10.1177/0013164419844305
1. In Ecuador’s national education system, the “EGB Middle” sublevel corresponds to students aged 9–11, the “EGB Upper” sublevel to students aged 12–14, and the “BGU” level to students aged 15–17. The final grade of each sublevel or level corresponds to 7th grade of EGB, 10th grade of EGB, and 3rd year of BGU, respectively.
Acknowledgments
This research is based on the master’s thesis titled Between Ethnocentrism and Eurocentrism: A Perspective on Intercultural Education and Its Relationship with Cultural Sensitivity. We express our deep gratitude to the Universidad Andina Simón Bolívar, Ecuador Campus, for the academic support and training provided throughout the research process. We also extend our sincere appreciation to Fundación Fe y Alegría Ecuador for their openness and collaboration, which made this study possible in their educational institutions.
Conflict of Interest Statement
The authors declare no conflicts of interest that could have influenced the conduct of this research.
Authorship Statement
Enoc Felipe Quishpe-Guano and Raúl Pérez-Fernández contributed to the writing and editing of the manuscript. Felipe Quishpe made a significant contribution to the study’s conceptualization, literature framework, systematization, and data analysis. Raúl Pérez-Fernández made a substantial contribution to the writing and editing of specific sections. Both authors reviewed and approved the final version of the manuscript.
Ethics Declaration
Data collection was carried out with the informed consent of participants, ensuring respect for their privacy and the confidentiality of the information obtained.
Quishpe, F., & Pérez-Fernández, R. (2025). Validation of the Chen and Starosta Intercultural Sensitivity Scale with Ecuadorian Secondary School Students. Revista Andina de Educación OF. Published under license CC BY-NC 4.0 ![]()
![]()
![]()